


Wow, the payment to finance a median priced home is nearly unchanged from over 30 years ago:
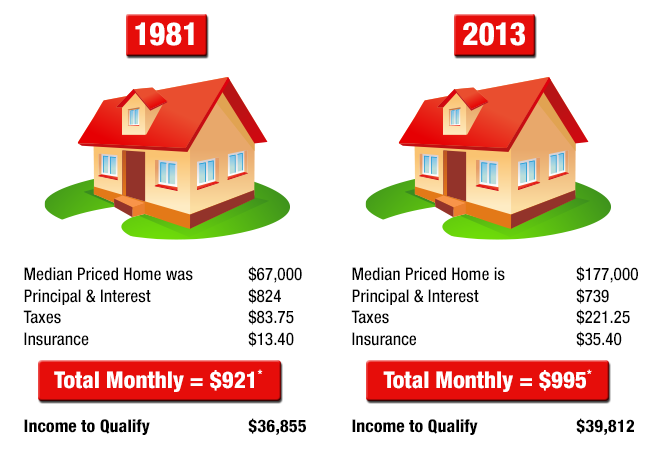
This comparison is all the more dramatic when you realize that $921 was a much larger percentage of average income in 1981 than it is today.
This won’t last forever! Interest rates are still historically low, yet expectations and improvements in the economy are already causing rates to rise. We probably will not return to the lofty levels of the 80s, but even a small rate increase can mean big changes in cost.
Are you ready to take advantage of this historic affordability? Whether you, a friend or a family member is thinking of purchasing a home or refinancing, contact us, and we’ll be happy to help.
* These figures are historical illustrations for educational purposes only and not an offer or a commitment to lend. Prices are based on rounded U.S. median average sales prices. Rates are reflective of a conventional 30 year fixed rate loan peak for 1981 of 18.375%/18.96% APR and the approximate national average from late June 2013 of 4.75%/5.02% APR. APRs and principal and interest are based on closing costs of 3% of the loan amount and an 80% loan to value. Actual closing fees can be less. Taxes are based on a factor of 1.5% of the sales price. Insurance is based on a cost of $3 per $1,000 of loan amount. Actual current rates, prices, taxes & insurance can vary at any time and are subject to change without notice. Income to qualify is based on a ratio of 30%. Actual ratio used for various loan programs can be higher or lower. Individual ability to qualify is also dependent on total debts and other factors such as but not limited to employment, credit and available funds to close.